Strategy, Analytics & Reporting
Know Exactly What's Working. Scale What Matters.
Conversion tracking, call tracking, custom dashboards, and ongoing optimization. No guessing. Just clear data that tells you where your leads come from and what to do next.
Real Dashboards. Real Client Data.
Every client gets custom reporting dashboards that show exactly where leads come from, what's converting, and where to invest next. Here's what that looks like in practice.
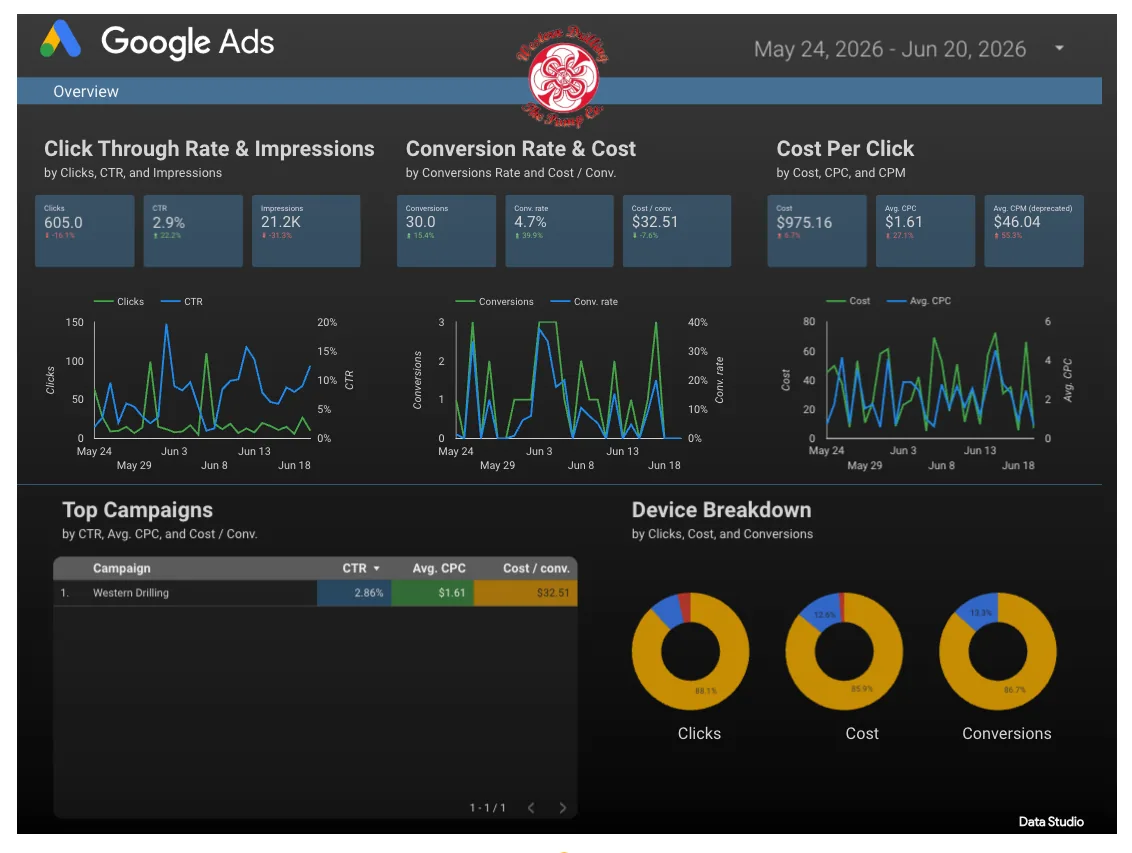
Google Ads Dashboard — 605 clicks, 2.9% CTR, 30 conversions at $32.51 per conversion. Every metric tracked, every dollar accounted for. This is how we prove ROI.
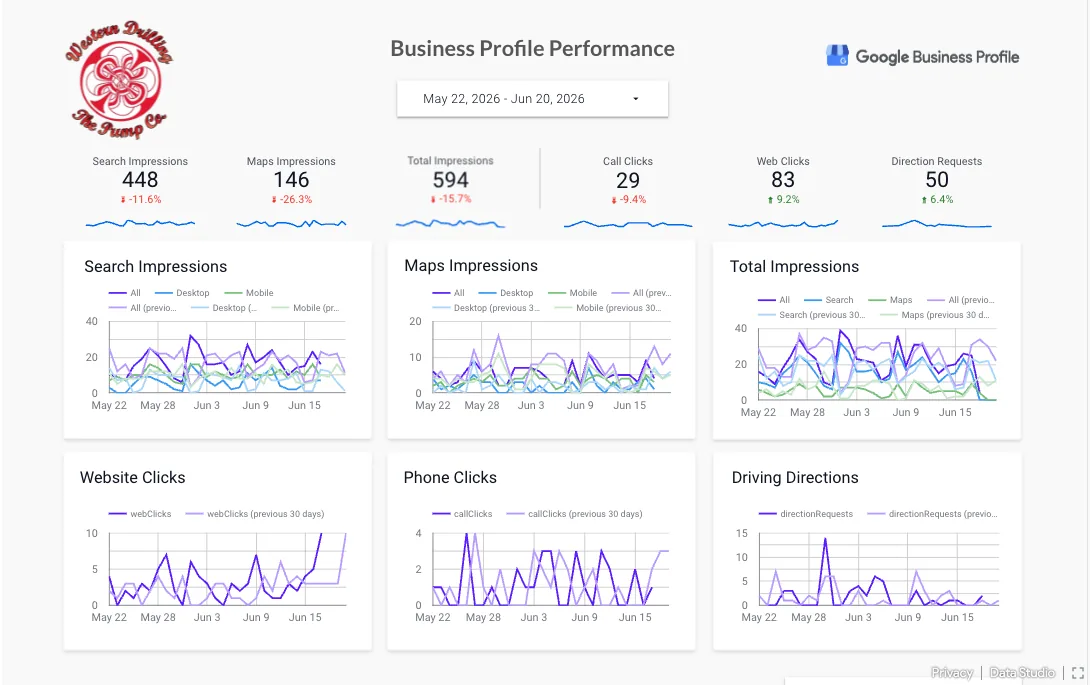
GBP Performance (30-day) — Search impressions, Maps impressions, call clicks, web clicks, and direction requests. All tracked against the previous period.
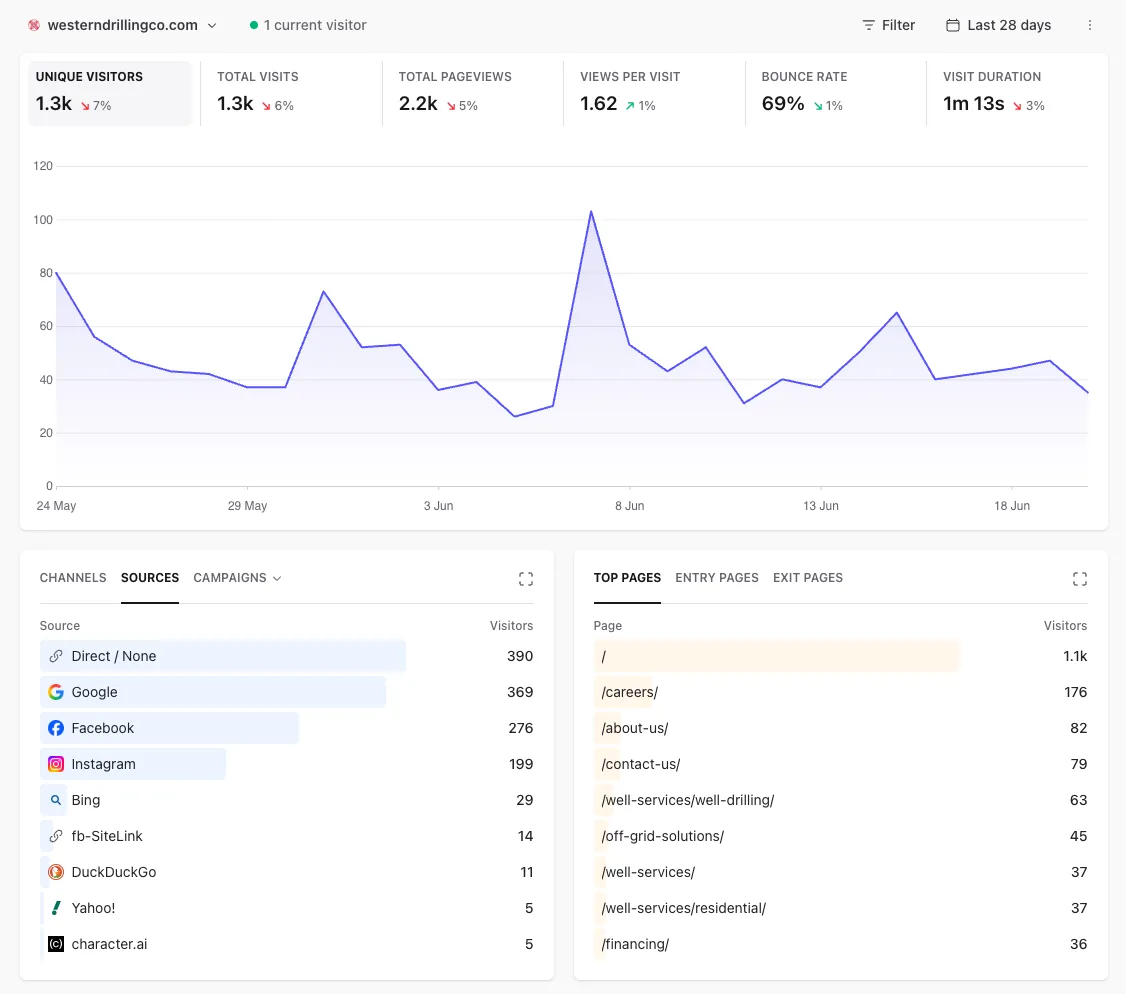
Website Analytics — 1.3K unique visitors, traffic sources (Google, Facebook, Instagram, Direct), top pages, and engagement metrics. Know where people come from and what they do.
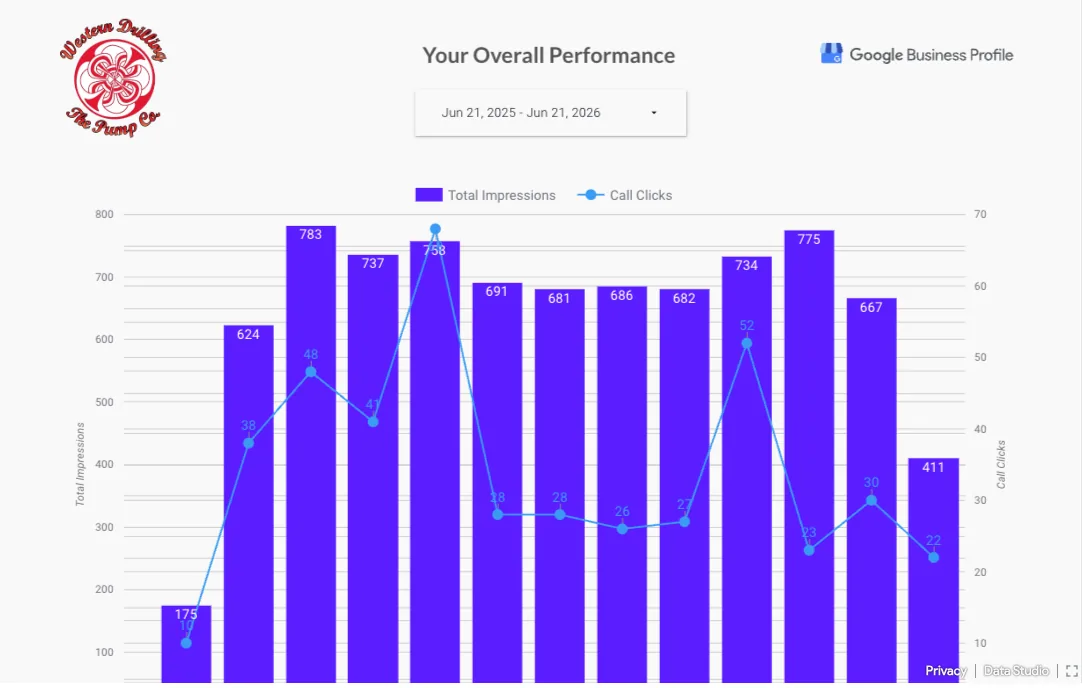
GBP Growth (12-month) — Impressions grew from 175/month to 775/month over one year. Call clicks followed the same trajectory. This is what consistent optimization looks like.
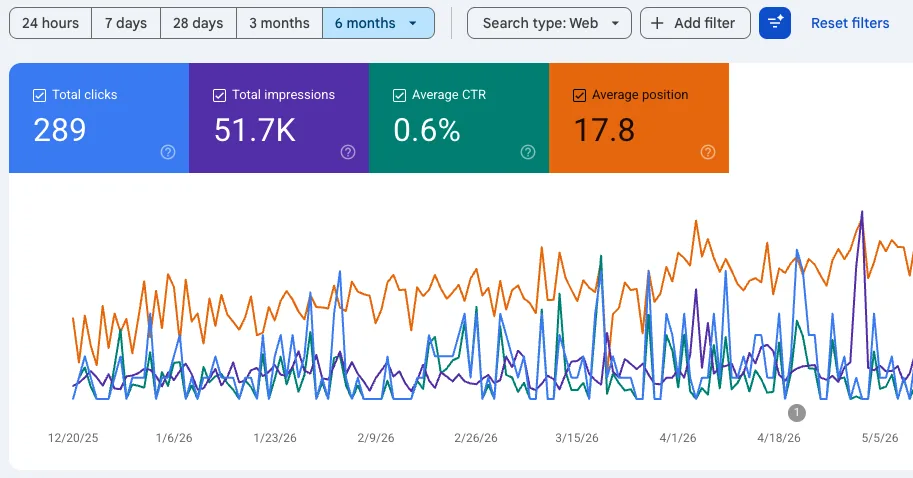
Search Console (6-month) — 289 clicks, 51.7K impressions, average position 17.8. Organic visibility tracked and improving month over month.
See the Dashboard in Action
David walks through our reporting dashboards, how we use them to make decisions, and how clients access their data in real time.
5-Minute Overview
Why we built these dashboards, how clients access them, and what makes our reporting different from other agencies.
Full Dashboard Tour (13 min)
A complete walkthrough of every section: website analytics, GBP insights, Google Ads, Meta Ads, reviews, and the content hub.
"All this data is live, up to the minute. We're not making it up. There's going to be good months, there's going to be bad months. But you'll always see the real numbers."
— David, Inspired Marketing & Design
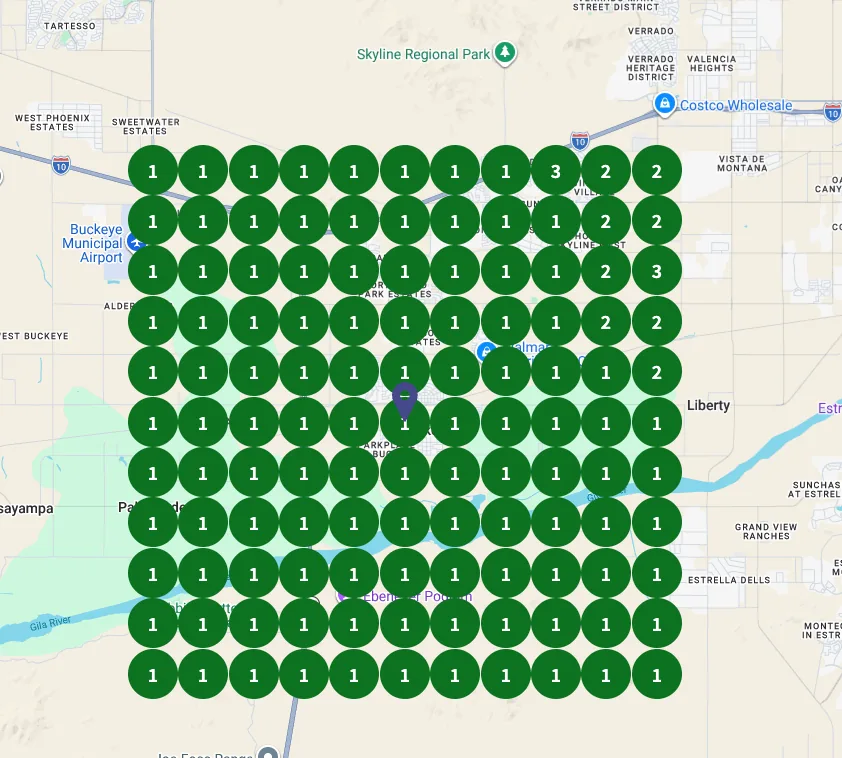
Local Ranking Visibility
We track your Google Maps ranking from every point in your service area using geo-grid technology. Each circle represents a search from that location, and the number shows where you rank.
Green means #1. This client dominates their entire service area with nearly all #1 positions across the grid. That's not luck. That's consistent GBP optimization, review strategy, and local SEO working together over time.
This is the kind of data that drives decisions. When we see a few #2 or #3 positions on the edges, we know exactly where to focus next. No guessing, just targeted action.
What's Included
Tracking & Analytics
- Google Analytics 4 setup and configuration
- Conversion tracking across all platforms
- Call tracking with source attribution
- Form submission tracking and lead scoring
- Google Tag Manager implementation
- Cross-platform attribution modeling
Reporting & Strategy
- Custom dashboards with real-time data
- Live client-accessible dashboards (password-protected)
- Monthly performance reports with insights
- Campaign optimization recommendations
- Content and branding hub with shared media uploads
- Budget allocation strategy
- Competitive analysis and benchmarking
- Quarterly strategy reviews and planning
Frequently Asked Questions
Ready to Work with Inspired?
You've done the hard part by building something worth marketing. Now let's get it the attention it deserves.
Or call us directly: (480) 799-7045